admin: First posted on 2012 01 19
We were working recently on version 3 of Orinj. We wanted to improve the graphs of several of the DSP effects in Orinj to include the actual magnitude response of the effect. This included effects that have graphs with some equalization or some frequency type filters – the graphic and parametric equalizer, the reverb (because of its parametric equalizer), and the notch filter. This post is about computing the actual magnitude response quickly and efficiently.
Actual magnitude response of the Orinj parametric equalizer
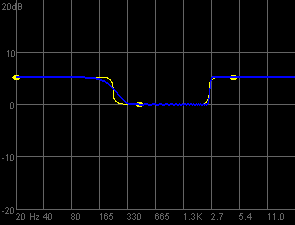
The following is the magnitude response of the Orinj parametric equalizer with the "brightness and bass" preset.

The yellow line shows the intended magnitude response of the equalizer, giving approximately 5 dB gain to frequencies below 230 Hz and to frequencies above 2500 Hz. The blue line shows the actual magnitude response of the equalizer. There are two differences. Since the equalizer employs finite impulse response filters, which have the characteristic Gibbs phenomenon ripples, there are ripples in the actual magnitude response. Since it is hard to get a steep transition at low frequencies with short finite impulse response filters, the transition of the actual magnitude response between the 5 dB gain at low frequencies to 0 dB gain at middle frequencies is not as steep, as the transition of the intended magnitude response. This graph is much better than the original graph of the Orinj version 2 parametric equalizer, as it shows exactly what the equalizer will do. It does not just show what the equalizer was intended to do.
Computing the actual magnitude response
Computing the actual magnitude response and drawing the graph is not complicated. Even if we do not know anything else, we can use a brute force approach. Take a frequency f, create a sine wave sin(2π f k / fs) at that frequency, given the sampling frequency fs, with peak amplitude of 1 (which means root mean square amplitude of 0.707107), put the wave through the equalizer computations, compute the root mean square amplitude of the resulting wave y(k), and compare the two amplitudes. The normalized magnitude response at f then would be the ratio of the RMS amplitude of the output over the RMS amplitude of the input at f. In decibels, it is


This brute force approach is easy, but it is too slow. We would want the actual magnitude response (the blue line above) to change automatically as the user changes the gain, frequency, and precision sliders of the equalizer.
Alternatively, the magnitude response of the finite impulse response filter is the frequency content of the filter of length N. The amplitude at some integer frequency f is

This computation is the root mean square amplitude of the output at the specific frequency and we still need to compute decibels. It is much faster, but we can do better.
A finite impulse response filter a(k) of length N (such as our equalizer), computes the output y(k) from the input x(k) with the formula

Taking the Z transform of both sides, we can compute the general form of the transfer function of a finite impulse response filter. It is the following.

If we have structured our equalizer properly, it will be the sum of several finite impulse response filters – low pass, high pass, or band pass – that are all symmetric around the middle. Since we are working with filters with symmetric coefficients, we can combine the first and last term, the second and second last term, and so on, and we can denote the middle M = (N – 1) / 2, assuming N is odd as it usually is. At z = e-j ω, where it is appropriate to compute the magnitude response

The magnitude response is

Here of course the angular frequency ω is ω = 2 π f / fs for some frequency f and given the sampling frequency fs. And, again, we still need to compute the magnitude response in decibels. This is, however, the fastest way to compute the filter's magnitude response.
authors: mic
Add new comment