The coefficients a(k) of the Dolph-Chebychev window are as follows.
$$a(k)=\frac{1}{N} \sum_{n=0}^{M} \frac{T_{2M}(\frac{\cos(\omega_n / 2)}{\cos(\omega_0 / 2)})}{T_{2M}(\frac{1}{\cos(\omega_0 / 2)})}\, \cos((k-M)\omega_n)$$
where N is the length of the window; M = (N – 1) / 2; k = 0, 1, …, N; ωn = n π / (N – 1), ω0 is a constant parameter (ω0 > 0), T2M are the Chebychev polynomials
$$T_{2M}(x)=\begin{cases} \cos(2\,M\, \mathrm{acos}(x)), & |x|\le1 \\ \cosh(2\,M\, \mathrm{acosh}(x)), & |x|\gt1
\end{cases}$$
and cosh and acosh are the hyperbolic cosine and arccosine
$$\cosh(x)=\frac{1}{2} (e^x+e^{-x})$$ $$\mathrm{acosh}(x)=ln(x+\sqrt{x^2-1}), \,x\ge1$$
Note that this window does not peak at 1, but can be normalized to do so.
$$a(k)=\frac{a(k)}{a(M)}$$
The term 1 / N before the sum in the first formula above is unnecessary, but it is there to ensure that the formula resembles the inverse discrete Fourier transform, as explained below.
The values of ω0 are usually small (< 0.1; although the examples provided below use larger values due to precision issues). Other definitions of the Dolph-Chebychev window may use
$$\frac{1}{\cos(\frac{\omega_0}{2})}=\cosh(\frac{1}{N} \, \mathrm{acosh}(10^\alpha))$$
Here, the constant parameter α > 0 ensures that 1 / cos(ω0 / 2) ≥ 1 and that 1 / cos(ω0 / 2) is approximately equal to 1. This in turn creates a Dolph-Chebychev window, the main lobe (of the window, not the filter) of which is relatively wide and the side portions of the window – the ones that compress the side lobes of the filter – are relatively short. This is equivalent to using values for ω0 that are close to zero.
Motivation behind the Dolph-Chebychev window
Consider the function
$$H(\omega)=\frac{T_{2M}(\frac{\cos(\omega / 2)}{\cos(\omega_0 / 2)})}{T_{2M}(\frac{1}{\cos(\omega_0 / 2)})}$$
As ω goes between 0 and ω0, H decreases from 1 to 1 / T2M (1 / cos(ω0 / 2)). As ω continues between ω0 and π, H moves between 1 / T2M (1 / cos(ω0 / 2)) and -1 / T2M (1 / cos(ω0 / 2)). Just to put things in perspective, at ω0 = 1 and M = 100, T2M (1 / cos(ω0 / 2)) = 1.15E+45 and 1 / T2M (1 / cos(ω0 / 2)) = 8.71E-46. With these same parameters, the function is the one shown on the graph below.
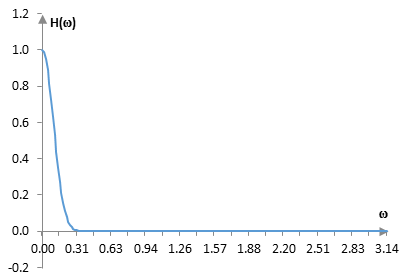
On one hand, this function could be a realistic magnitude response of a low pass filter, although it decreases very quickly. Even though this is difficult to see on the graph, ω0 is the frequency at which the magnitude response H(ω) of the Dolph-Chebychev window reaches its "stop band". To compute the Dolph-Chebychev filter from this function one can take its inverse Fourier transform (with its mirror image and shifted to be centered at M, rather than at 0). This produces the function shown at the very top of this topic.
On the other hand, this function resembles an impulse. Since the Fourier transform of the product of two functions (filter and the window) is the convolution of two Fourier transforms (the transform of the filter and the transform of the window), the Fourier transform of the window acts as a filter on the Fourier transform of the filter. In other words, the magnitude response of the window (in the graph above) acts as a filter on the magnitude response of the filter on which the window is applied.
The smaller the value of ω0 in the Dolph-Chebychev window, the more this function resembles an impulse and acts similarly to an all pass filter on the magnitude response of a finite impulse response filter. The magnitude response of the filter remains almost unchanged, as if applying a rectangular window. With smaller ω0, the Dolph-Chebychev window is closer to a rectangular window. With larger ω0, the lobe in the magnitude response graph above becomes larger, and the Dolph-Chebychev window creates a smoother magnitude response for the filter.
Example Dolph-Chebychev windows
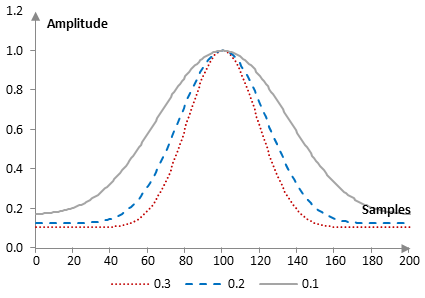
The following is the Dolph-Chebychev window for three different values of ω0 (0.1, 0.2, and 0.3), with N = 201 and M = 100.
Suppose that the sampling frequency is 2000 Hz. Take a low pass filter with a cutoff frequency of 40 Hz. The magnitude responses of the three corresponding filters are shown on the graph below.
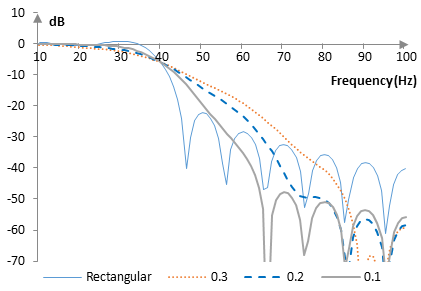
As ω0 increases, the Dolph-Chebychev window becomes narrower, the stop band attenuation of the corresponding filter improves, but its transition band becomes larger.
A note on the parameter M
In principle, when designing the Dolph-Chebychev window, there is no need to link the parameter M in the Chebychev polynomials T2M to the number of points N in the inverse Fourier transform (in the formulae above M = (N – 1) / 2). We can write the formula for the Dolph-Chebychev window as
$$a(k)=\frac{1}{N} \sum_{n=0}^{M} \frac{T_{2L}(\frac{\cos(\omega_n / 2)}{\cos(\omega_0 / 2)})}{T_{2L}(\frac{1}{\cos(\omega_0 / 2)})}\, \cos((k-M)\omega_n)$$
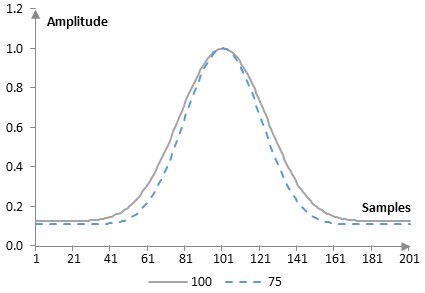
where there is no relationship between N and L. The following is the Dolph-Chebychev window of the previous example with ω0 = 0.2 and at L = 100 and L = 75.
The magnitude responses of the corresponding filters of length 201 and cutoff frequency 40 Hz are as follows.
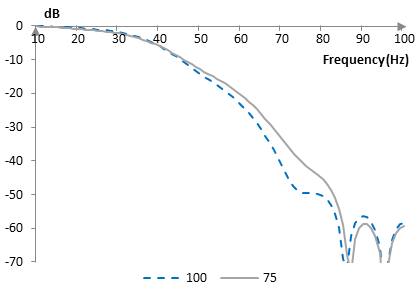
All else equal, larger L will produce a Dolph-Chebychev window with a wider lobe and a corresponding filter with a better stop band attenuation, but a wider transition band.
Measures of the Dolph-Chebychev window
The following is a plot of the discrete Fourier transform of the Dolph-Chebychev window against the discrete Fourier transform of the rectangular window (with ω0 = 0.1).
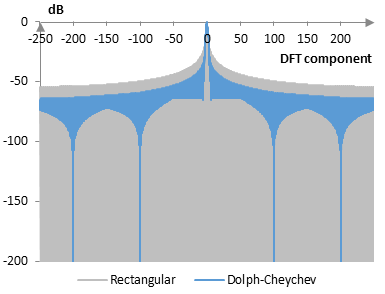
The measures of the Dolph-Chebuchev window are as follows.
| ω0 = 0.1 | ω0 = 0.2 | ω0 = 0.3 | |
| Coherent gain | 0.34 | 0.25 | 0.20 |
| Equivalent noise bandwidth | 1.80 | 2.33 | 2.72 |
| Processing gain | -2.56 dB | -3.66 dB | -4.35 dB |
| Scalloping loss | -1.44 dB | -1.28 dB | -1.23 dB |
| Worst case processing loss | -4.00 dB | -4.94 dB | -5.58 dB |
| Highest sidelobe level | -29.6 dB | -31.9 dB | -35.1 dB1 |
| Sidelobe falloff | -7.1 dB / octave, -23.5 dB / decade | -7.1 dB / octave, -23.5 dB / decade | -7.1 dB / octave, -23.5 dB / decade |
| Main lobe is -3 dB | 1.46 bins | 1.58 bins | 1.64 bins |
| Main lobe is -6 dB | 2.18 bins | 2.58 bins | 3.48 bins |
| Overlap correlation at 50% overlap | 0.155 | 0.120 | 0.102 |
| Amplitude flatness at 50% overlap | 0.272 | 0.154 | 0.127 |
| Overlap correlation at 75% overlap | 0.440 | 0.261 | 0.201 |
| Amplitude flatness at 75% overlap | 0.914 | 0.579 | 0.377 |
1 As ω0 increases, each of the side lobes closest to the main lobe of the Dolph-Chebychev window's discrete Fourier transform disappears gradually. These highest sidelobe levels are not precise to the extent that there may be a sidelobe closer to the main lobe that has not yet been flattened out.
See also:
Window
Add new comment